[SOLVED] K8s Core on top of OpenStack

I’m deployed Kubernetes Core on my private cloud (Openstack lab) to study how K8S works, but I can’t view its gui. Of following I show you my Lab:

IP plan:

Network: 10.20.81.0/24
Maas: 10.20.81.1
Juju: 10.20.81.2
Openstack: 10.20.81.21-24
External Gateway: 10.20.81.254
Private Network: 10.1.0.0/24
Private Gateway: 10.1.0.1
Private DHCP service: 10.1.0.10

Network topology:

                          +-------------+
                              Firewall
                            10.20.81.254
                          +-------------+
                                 | 
  +-------------------------------------------------------------+
                              Switch 
  +-------------------------------------------------------------+
        |                   |                   || | | |
+--------------+     +-------------+       +------------------+
|Maas+Juju           |Juju Gui             |Openstack
|10.20.81.1          |10.20.81.2           |10.20.81.21-24
+--------------+     +-------------+       +------------------+
                                                     |
                                +----------------------------------------+
                                Private Subnet-1           Public Subnet-2
                                 10.1.0.0/24                10.20.81.0/24
                                 +---+--+--+                +---+------+
                                 |         |
                                 |         |
                               +-+-+     +-+-+       
                               |    |    |   |
                               |Juju|    |K8s|  
                               |Gui |    |   |
                               |    |    |   |
                               +----+    +---+

The task of its deploy from JUJU to OPENSTACK works right, here is its own status

$:juju status
Model             Controller            Cloud/Region               Version  SLA          Timestamp
kubernetes-cloud  openstack-controller  openstack-cloud/RegionOne  2.5.4    unsupported  08:24:06Z

App                Version  Status  Scale  Charm              Store       Rev  OS      Notes
easyrsa            3.0.1    active      1  easyrsa            jujucharms  235  ubuntu  
etcd               3.2.10   active      1  etcd               jujucharms  415  ubuntu  
flannel            0.10.0   active      2  flannel            jujucharms  404  ubuntu  
kubernetes-master  1.14.1   active      1  kubernetes-master  jujucharms  654  ubuntu  exposed
kubernetes-worker  1.14.1   active      1  kubernetes-worker  jujucharms  519  ubuntu  exposed

Unit                  Workload  Agent  Machine  Public address  Ports           Message
easyrsa/0*            active    idle   1/lxd/0  10.27.75.36                     Certificate Authority connected.
etcd/0*               active    idle   1        10.1.0.13       2379/tcp        Healthy with 1 known peer
kubernetes-master/0*  active    idle   1        10.1.0.13       6443/tcp        Kubernetes master running.
  flannel/1           active    idle            10.1.0.13                       Flannel subnet 10.1.80.1/24
kubernetes-worker/0*  active    idle   0        10.1.0.15       80/tcp,443/tcp  Kubernetes worker running.
  flannel/0*          active    idle            10.1.0.15                       Flannel subnet 10.1.19.1/24

Machine  State    DNS          Inst id                               Series  AZ    Message
0        started  10.1.0.15    c68e8cc3-e85f-4c90-b5d3-0119938f893e  bionic  nova  ACTIVE
1        started  10.1.0.13    8f13da27-9ea3-4464-9411-e2875d131c51  bionic  nova  ACTIVE
1/lxd/0  started  10.27.75.36  juju-1284d9-1-lxd-0                   bionic  nova  Container started

then

$:juju ssh kubernetes-master/0

ubuntu@juju-1284d9-kubernetes-cloud-0:~$ kubectl cluster-info
Kubernetes master is running at https://10.1.0.13:6443
Heapster is running at https://10.1.0.13:6443/api/v1/namespaces/kube-system/services/heapster/proxy
CoreDNS is running at https://10.1.0.13:6443/api/v1/namespaces/kube-system/services/kube-dns:dns/proxy
Metrics-server is running at https://10.1.0.13:6443/api/v1/namespaces/kube-system/services/https:metrics-server:/proxy
Grafana is running at https://10.1.0.13:6443/api/v1/namespaces/kube-system/services/monitoring-grafana/proxy
InfluxDB is running at https://10.1.0.13:6443/api/v1/namespaces/kube-system/services/monitoring-influxdb:http/proxy

To further debug and diagnose cluster problems, use 'kubectl cluster-info dump'.
ubuntu@juju-1284d9-kubernetes-cloud-0:~$ 

Then I’ve assigned to the instance kubernetes-master/0 a floating IP but if I try to open that on my browser the result is

404 Not Found
nginx/1.15.8

As suggested of its guide

kubectl proxy

By default, this establishes a proxy running on your local machine and the
kubernetes-master unit. To reach the Kubernetes dashboard, visit
http://localhost:8001/api/v1/namespaces/kube-system/services/https:kubernetes-dashboard:/proxy/

but in my case I 'd view its own dashboard using floating IP assigned. Someone can help me? thanks

Possibly try to square away all access details about how you get in and out of networks in Openstack, learn how Openstack networking works by making stupid simple tests that give you definite answers about the topology of your network and how things route/connect in and out of the openstack.

Edit: @riccardo-magrini your underlying network looks legitimate, didn’t mean to knock it here, just what first jumped out at me.

Possibly try crawling first and getting familiar with landscape, then walking, running, then try flying … seems you are trying to go straight to fly😀

Edit: Looks like you are already basically running, so scratch that.

Some of the things that helped me come up to speed here:

  1. Learn as much as one can about Openstack/neutron networking as this knowledge will make the ride easier the more you know.
    A) Understand the difference between the internal and external networks, different Openstack network backends, configurations and how juju model-config needs to be configured to utilize openstack networks.
    B) Deploy instances to different network configurations and jump in and learn what it is you are working with.
    C) Try to understand as much as possible how Openstack networking works before deploying kubernetes on top of it.

  2. Deploy k8s on Openstack and give ‘kubectl proxy’ a whirl😀

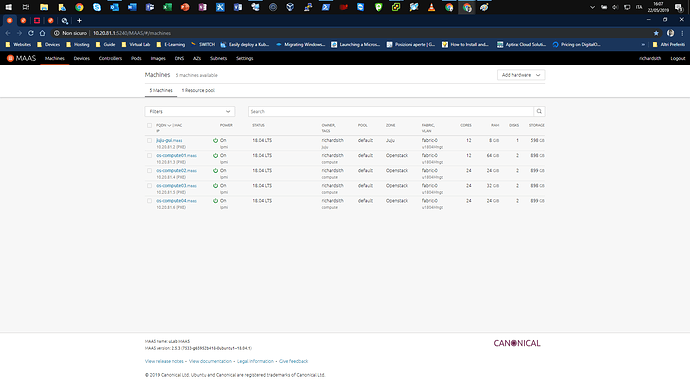
nice answer, don’t worry I go slowly slowly never fast :slight_smile: :slight_smile: anyway this is my lab:

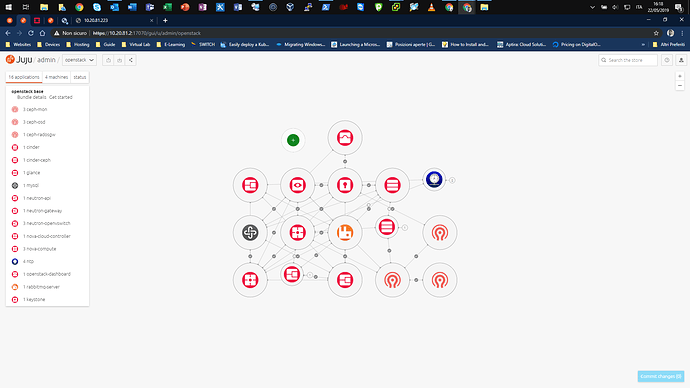
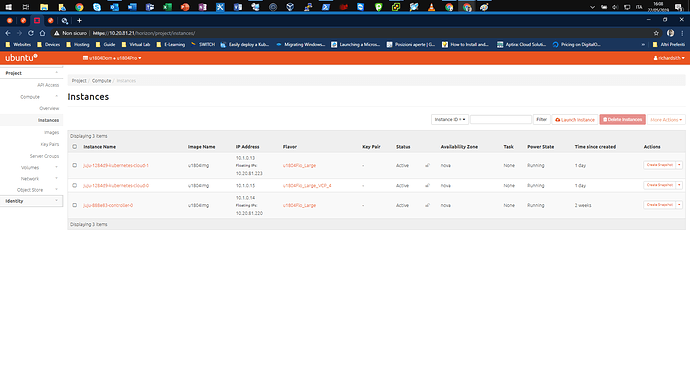
maas

maas + juju

openstack + juju controller

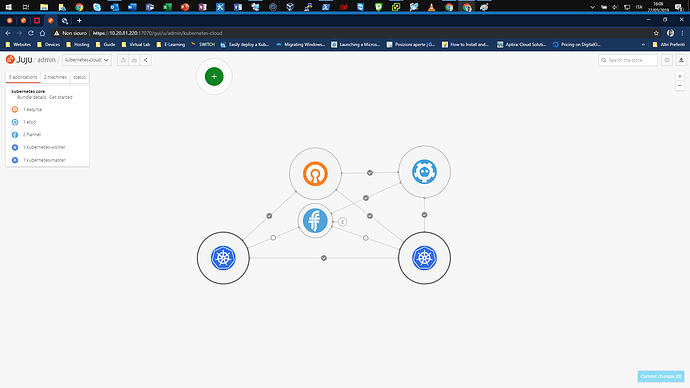
kubernetes core

I’ve assigned to kubernetes-master/0 the floating ip 10.20.81.233 and tring to open that on my broswer there is that

ubuntu@juju-1284d9-kubernetes-cloud-1:~$ kubectl cluster-info
Kubernetes master is running at http://localhost:8080
Heapster is running at http://localhost:8080/api/v1/namespaces/kube-system/services/heapster/proxy
CoreDNS is running at http://localhost:8080/api/v1/namespaces/kube-system/services/kube-dns:dns/proxy
Metrics-server is running at http://localhost:8080/api/v1/namespaces/kube-system/services/https:metrics-server:/proxy
Grafana is running at http://localhost:8080/api/v1/namespaces/kube-system/services/monitoring-grafana/proxy
InfluxDB is running at http://localhost:8080/api/v1/namespaces/kube-system/services/monitoring-influxdb:http/proxy

ubuntu@juju-1284d9-kubernetes-cloud-1:~$ kubectl get services kubernetes-dashboard -n kube-system 
NAME                   TYPE        CLUSTER-IP       EXTERNAL-IP   PORT(S)   AGE
kubernetes-dashboard   ClusterIP   10.152.183.234   <none>        443/TCP   2d
1 Like

:+1::+1::+1::+1::+1::+1::+1::+1::+1:Sweet​:+1::+1::+1::+1::+1::+1::+1::+1::+1:

3 Likes

Looking at your setup, it looks like you should be able to get k8s working on top of what you have. I see you have created an openstack external network that is the same network that your maas hosts live on. So long as you configure your juju model to use the openstack external network/floating ips, you shoudl be able to get something up and running with what you have there using cdk.

For reference, deploying CDK on AWS using networks with internet gateways, I get public ips in my kubectl cluster-info:

$ kubectl cluster-info
Kubernetes master is running at https://34.223.238.20:443
Heapster is running at https://34.223.238.20:443/api/v1/namespaces/kube-system/services/heapster/proxy
CoreDNS is running at https://34.223.238.20:443/api/v1/namespaces/kube-system/services/kube-dns:dns/proxy
Metrics-server is running at https://34.223.238.20:443/api/v1/namespaces/kube-system/services/https:metrics-server:/proxy
Grafana is running at https://34.223.238.20:443/api/v1/namespaces/kube-system/services/monitoring-grafana/proxy
InfluxDB is running at https://34.223.238.20:443/api/v1/namespaces/kube-system/services/monitoring-influxdb:http/proxy

Maybe a simple test once you feel you have the network config 100% could be to see that you are getting an ip from your host network, specifically the ip assigned to the k8s master in the kubectl cluster-info output.

Also, in your output above, it seems only one of your k8s nodes got an external network ip.

Can you share your juju model-config for the openstack model?

Oh I think I see something. You are running kubectl cluster-info from the master itself. If I jump into my kubernetes-master and run kubectl cluster-info from the master host I get the same output as you:

$ kubectl cluster-info
Kubernetes master is running at http://localhost:8080
Heapster is running at http://localhost:8080/api/v1/namespaces/kube-system/services/heapster/proxy
CoreDNS is running at http://localhost:8080/api/v1/namespaces/kube-system/services/kube-dns:dns/proxy
Metrics-server is running at http://localhost:8080/api/v1/namespaces/kube-system/services/https:metrics-server:/proxy
Grafana is running at http://localhost:8080/api/v1/namespaces/kube-system/services/monitoring-grafana/proxy
InfluxDB is running at http://localhost:8080/api/v1/namespaces/kube-system/services/monitoring-influxdb:http/proxy

@riccardo-magrini scp the kubeconfig to your local box and run kubectl cluster-info from your local and you should then get the external ip assigned to the kubernetes-master in your kubectl cluster-info.

I’m pretty sure if you use juju model config to setup the floating/external network such that both your k8s master and worker get external ips via juju instead of assigning the floating ip manually you will be able to successfully access your k8s from your local and kubectl proxy should work correctly from your local box.

The reason I think this is because I feel that the kubeconfig may need to be generated with the external ip already assigned to the instance such that the external ip exist at the time when the charms are configuring and it makes it into the kubeconfig. If you don’t have floating ip assigned at deploy time and manually assign it following deploy, you may need to modify the kubeconfig to contain it.

1 Like

could you explain how have I do that?

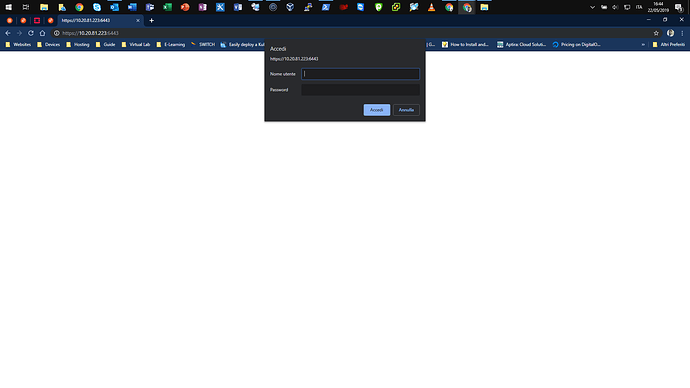
I’ve tried to assign on both instance a floating IP and checked on Juju also if k-master and k-workes had the expose task actived, but nothing k8 dashboard. I can’t explain me which are the credential it asks me in https://10.20.81.223:6443/ (look the above picture).

I’ll continue to look for a solution but I think you right when say:

I think this is because I feel that the kubeconfig may need to be generated with the external ip already assigned to the instance such that the external ip exist at the time when the charms are configuring and it makes it into the kubeconfig. If you don’t have floating ip assigned at deploy time and manually assign it following deploy, you may need to modify the kubeconfig to contain it

I’ve tried to set in the charm kubernetes-master/0 a password in client_password(string) and after to open the floating address https://10.20.81.223:6443/ui and insert admin 'n pwd the result is this:

{
“paths”: [
“/apis”,
“/apis/”,
“/apis/apiextensions.k8s.io”,
“/apis/apiextensions.k8s.io/v1beta1”,
“/healthz”,
“/healthz/etcd”,
“/healthz/log”,
“/healthz/ping”,
“/healthz/poststarthook/crd-informer-synced”,
“/healthz/poststarthook/generic-apiserver-start-informers”,
“/healthz/poststarthook/start-apiextensions-controllers”,
“/healthz/poststarthook/start-apiextensions-informers”,
“/metrics”,
“/openapi/v2”,
“/version”
]
}

on the instance where it has been deployed

$:juju ssh kubernetes-master/0

ubuntu@juju-c7d49b-kubernetes-cloud-1:~$ kubectl describe svc kubernetes-dashboard -n kube-system
Name:                     kubernetes-dashboard
Namespace:                kube-system
Labels:                   cdk-addons=true
                          k8s-app=kubernetes-dashboard
Annotations:              kubectl.kubernetes.io/last-applied-configuration:
                            {"apiVersion":"v1","kind":"Service","metadata":{"annotations":{},"labels":{"cdk-addons":"true","k8s-app":"kubernetes-dashboard"},"name":"k...
Selector:                 k8s-app=kubernetes-dashboard
Type:                     NodePort
IP:                       10.152.183.71
Port:                     <unset>  443/TCP
TargetPort:               8443/TCP
NodePort:                 <unset>  31530/TCP
Endpoints:                10.1.21.5:8443
Session Affinity:         None
External Traffic Policy:  Cluster
Events:                   <none>

then

ubuntu@juju-c7d49b-kubernetes-cloud-1:~$ kubectl proxy
Starting to serve on 127.0.0.1:8001

opening the url:
https://10.20.81.226:8001/api/v1/namespaces/kube-system/services/https:kubernetes-dashboard:/proxy/

nothing the page is white!

I’ve also tried to deploy K8s Core using as IPs address directly the floating network, but the 2 instances created, in Juju are been in pending for long time without doing nothing.

Try deploying singleton ubuntu instances on openstack (crawl) and figure out the access/network details (walk) then try running something like CDK on top of it (run) :slight_smile:

Hi jamesbeedy,

I’ve deployed an Ubuntu via Juju

$:juju status
Model         Controller            Cloud/Region               Version  SLA          Timestamp
ubuntu-cloud  openstack-controller  openstack-cloud/RegionOne  2.5.4    unsupported  10:35:00Z

App     Version  Status  Scale  Charm   Store       Rev  OS      Notes
ubuntu  18.04    active      1  ubuntu  jujucharms   12  ubuntu  

Unit       Workload  Agent  Machine  Public address  Ports  Message
ubuntu/3*  active    idle   2        10.1.0.13              ready

Machine  State    DNS        Inst id                               Series  AZ    Message
2        started  10.1.0.13  b4e4609b-f6c1-4178-aa35-55efe870a943  bionic  nova  ACTIVE

then i’ve installed MicroK8s:

$:juju ssh ubuntu/3

ubuntu@juju-91824f-ubuntu-cloud-2:~$ microk8s.kubectl get all --all-namespaces | grep service/kubernetes-dashboard

ubuntu@juju-91824f-ubuntu-cloud-2:~$  microk8s.status 
microk8s is running
addons:
jaeger: disabled
fluentd: disabled
gpu: disabled
storage: disabled
registry: disabled
ingress: disabled
dns: disabled
metrics-server: disabled
prometheus: disabled
istio: disabled
dashboard: disabled

ubuntu@juju-91824f-ubuntu-cloud-2:~$ microk8s.enable dns dashboard
Enabling DNS
Applying manifest
service/kube-dns created
serviceaccount/kube-dns created
configmap/kube-dns created
deployment.extensions/kube-dns created
Restarting kubelet
DNS is enabled
Enabling dashboard
secret/kubernetes-dashboard-certs created
serviceaccount/kubernetes-dashboard created
deployment.apps/kubernetes-dashboard created
service/kubernetes-dashboard created
service/monitoring-grafana created
service/monitoring-influxdb created
service/heapster created
deployment.extensions/monitoring-influxdb-grafana-v4 created
serviceaccount/heapster created
configmap/heapster-config created
configmap/eventer-config created
deployment.extensions/heapster-v1.5.2 created
dashboard enabled

ubuntu@juju-91824f-ubuntu-cloud-2:~$ microk8s.kubectl get all --all-namespaces | grep service/kubernetes-dashboard

kube-system   service/kubernetes-dashboard   ClusterIP   10.152.183.65    <none>        443/TCP             8m16s

ubuntu@juju-91824f-ubuntu-cloud-2:~$ microk8s.kubectl cluster-info
Kubernetes master is running at https://127.0.0.1:16443
Heapster is running at https://127.0.0.1:16443/api/v1/namespaces/kube-system/services/heapster/proxy
KubeDNS is running at https://127.0.0.1:16443/api/v1/namespaces/kube-system/services/kube-dns:dns/proxy
Grafana is running at https://127.0.0.1:16443/api/v1/namespaces/kube-system/services/monitoring-grafana/proxy
InfluxDB is running at https://127.0.0.1:16443/api/v1/namespaces/kube-system/services/monitoring-influxdb:http/proxy

have you any tip to give me to view the dashboard UI on its floating IP (10.20.81.226)? thanks

Where did microk8s come from, and why? Pretty sure you are missing a juju model config. Can you post the output of ‘juju model-config’ please? Thanks!

it’s only a try…I want to see why I can’t view the dashboard of K8s Core on Openstack using a floating IP.

here is:

$:juju model-config
    Attribute                     From     Value
    agent-metadata-url            default  ""
    agent-stream                  default  released
    agent-version                 model    2.5.4
    apt-ftp-proxy                 default  ""
    apt-http-proxy                default  ""
    apt-https-proxy               default  ""
    apt-mirror                    default  ""
    apt-no-proxy                  default  ""
    automatically-retry-hooks     default  true
    backup-dir                    default  ""
    cloudinit-userdata            default  ""
    container-image-metadata-url  default  ""
    container-image-stream        default  released
    container-inherit-properties  default  ""
    container-networking-method   model    local
    default-series                default  bionic
    development                   default  false
    disable-network-management    default  false
    egress-subnets                default  ""
    enable-os-refresh-update      default  true
    enable-os-upgrade             default  true
    external-network              default  ""
    fan-config                    default  ""
    firewall-mode                 default  instance
    ftp-proxy                     default  ""
    http-proxy                    default  ""
    https-proxy                   default  ""
    ignore-machine-addresses      default  false
    image-metadata-url            default  ""
    image-stream                  default  released
    juju-ftp-proxy                default  ""
    juju-http-proxy               default  ""
    juju-https-proxy              default  ""
    juju-no-proxy                 default  127.0.0.1,localhost,::1
    logforward-enabled            default  false
    logging-config                model    <root>=DEBUG;unit=DEBUG
    max-action-results-age        default  336h
    max-action-results-size       default  5G
    max-status-history-age        default  336h
    max-status-history-size       default  5G
    net-bond-reconfigure-delay    default  17
    network                       model    2c44c892-1c51-45df-85eb-86c808a5d3ad
    no-proxy                      default  127.0.0.1,localhost,::1
    policy-target-group           default  ""
    provisioner-harvest-mode      default  destroyed
    proxy-ssh                     default  false
    resource-tags                 model    {}
    snap-http-proxy               default  ""
    snap-https-proxy              default  ""
    snap-store-assertions         default  ""
    snap-store-proxy              default  ""
    ssl-hostname-verification     default  true
    storage-default-block-source  model    cinder
    test-mode                     default  false
    transmit-vendor-metrics       default  true
    update-status-hook-interval   default  5m
    use-default-secgroup          default  false
    use-floating-ip               default  false
    use-openstack-gbp             default  false

You need to set both of these values if you want to use the openstack external/floating network. Once Juju is aware of your openstack external network, and that you want to use floating ips, things should go smoother for you.

in this way?

juju model-config external-network=0f3380e8-2983xxxxxxx
juju model-config use-floating-ip=true

but I’ve to run that before of the deploy of K8s, right?

yes :+1::+1::+1::+1::+1::+1:

I’m running a new model and the deploy of K8s Core, at the end I’ll inform you if everything works fine. :wink::crossed_fingers:

here is its juju status and config:

$:juju status
Model             Controller            Cloud/Region               Version  SLA          Timestamp
kubernetes-cloud  openstack-controller  openstack-cloud/RegionOne  2.5.4    unsupported  15:02:41Z

App                Version  Status  Scale  Charm              Store       Rev  OS      Notes
easyrsa            3.0.1    active      1  easyrsa            jujucharms  248  ubuntu  
etcd               3.2.10   active      1  etcd               jujucharms  426  ubuntu  
flannel            0.10.0   active      2  flannel            jujucharms  417  ubuntu  
kubernetes-master  1.14.2   active      1  kubernetes-master  jujucharms  678  ubuntu  exposed
kubernetes-worker  1.14.2   active      1  kubernetes-worker  jujucharms  536  ubuntu  exposed

Unit                  Workload  Agent  Machine  Public address  Ports           Message
easyrsa/0*            active    idle   0/lxd/0  10.174.10.62                    Certificate Authority connected.
etcd/0*               active    idle   0        10.20.81.223    2379/tcp        Healthy with 1 known peer
kubernetes-master/0*  active    idle   0        10.20.81.223    6443/tcp        Kubernetes master running.
  flannel/1           active    idle            10.20.81.223                    Flannel subnet 10.1.92.1/24
kubernetes-worker/0*  active    idle   1        10.20.81.226    80/tcp,443/tcp  Kubernetes worker running.
  flannel/0*          active    idle            10.20.81.226                    Flannel subnet 10.1.5.1/24

Machine  State    DNS           Inst id                               Series  AZ    Message
0        started  10.20.81.223  d65c91e7-0172-48fd-a218-35011344a103  bionic  nova  ACTIVE
0/lxd/0  started  10.174.10.62  juju-9cf030-0-lxd-0                   bionic  nova  Container started
1        started  10.20.81.226  08e11bf9-5834-4566-bc58-179f67316d88  bionic  nova  ACTIVE

------------------------------------------
Ubuntu 18.04 Maas Server Edition
$:juju model-config 
Attribute                     From     Value
agent-metadata-url            default  ""
agent-stream                  default  released
agent-version                 model    2.5.4
apt-ftp-proxy                 default  ""
apt-http-proxy                default  ""
apt-https-proxy               default  ""
apt-mirror                    default  ""
apt-no-proxy                  default  ""
automatically-retry-hooks     default  true
backup-dir                    default  ""
cloudinit-userdata            default  ""
container-image-metadata-url  default  ""
container-image-stream        default  released
container-inherit-properties  default  ""
container-networking-method   model    local
default-series                default  bionic
development                   default  false
disable-network-management    default  false
egress-subnets                default  ""
enable-os-refresh-update      default  true
enable-os-upgrade             default  true
external-network              model    0f3380e8-2983-4c09-b016-b13636cf8b9c
fan-config                    default  ""
firewall-mode                 default  instance
ftp-proxy                     default  ""
http-proxy                    default  ""
https-proxy                   default  ""
ignore-machine-addresses      default  false
image-metadata-url            default  ""
image-stream                  default  released
juju-ftp-proxy                default  ""
juju-http-proxy               default  ""
juju-https-proxy              default  ""
juju-no-proxy                 default  127.0.0.1,localhost,::1
logforward-enabled            default  false
logging-config                model    <root>=DEBUG;unit=DEBUG
max-action-results-age        default  336h
max-action-results-size       default  5G
max-status-history-age        default  336h
max-status-history-size       default  5G
net-bond-reconfigure-delay    default  17
network                       model    2c44c892-1c51-45df-85eb-86c808a5d3ad
no-proxy                      default  127.0.0.1,localhost,::1
policy-target-group           default  ""
provisioner-harvest-mode      default  destroyed
proxy-ssh                     default  false
resource-tags                 model    {}
snap-http-proxy               default  ""
snap-https-proxy              default  ""
snap-store-assertions         default  ""
snap-store-proxy              default  ""
ssl-hostname-verification     default  true
storage-default-block-source  model    cinder
test-mode                     default  false
transmit-vendor-metrics       default  true
update-status-hook-interval   default  5m
use-default-secgroup          default  false
use-floating-ip               model    true
use-openstack-gbp             default  false

but if i try to open https://10.20.81.223:6443 the answer is that:

“paths”: [
“/api”,
“/api/v1”,
“/apis”,
“/apis/”,
“/apis/admissionregistration.k8s.io”,
“/apis/admissionregistration.k8s.io/v1beta1”,
“/apis/apiextensions.k8s.io”,
“/apis/apiextensions.k8s.io/v1beta1”,
“/apis/apiregistration.k8s.io”,
“/apis/apiregistration.k8s.io/v1”,
“/apis/apiregistration.k8s.io/v1beta1”,
“/apis/apps”,
“/apis/apps/v1”,
“/apis/apps/v1beta1”,
“/apis/apps/v1beta2”,
“/apis/authentication.k8s.io”,
“/apis/authentication.k8s.io/v1”,
“/apis/authentication.k8s.io/v1beta1”,
“/apis/authorization.k8s.io”,
“/apis/authorization.k8s.io/v1”,
“/apis/authorization.k8s.io/v1beta1”,
“/apis/autoscaling”,
“/apis/autoscaling/v1”,
“/apis/autoscaling/v2beta1”,
“/apis/autoscaling/v2beta2”,
“/apis/batch”,
“/apis/batch/v1”,
“/apis/batch/v1beta1”,
“/apis/certificates.k8s.io”,
“/apis/certificates.k8s.io/v1beta1”,
“/apis/coordination.k8s.io”,
“/apis/coordination.k8s.io/v1”,
“/apis/coordination.k8s.io/v1beta1”,
“/apis/events.k8s.io”,
“/apis/events.k8s.io/v1beta1”,
“/apis/extensions”,
“/apis/extensions/v1beta1”,
“/apis/metrics.k8s.io”,
“/apis/metrics.k8s.io/v1beta1”,
“/apis/networking.k8s.io”,
“/apis/networking.k8s.io/v1”,
“/apis/networking.k8s.io/v1beta1”,
“/apis/node.k8s.io”,
“/apis/node.k8s.io/v1beta1”,
“/apis/policy”,
“/apis/policy/v1beta1”,
“/apis/rbac.authorization.k8s.io”,
“/apis/rbac.authorization.k8s.io/v1”,
“/apis/rbac.authorization.k8s.io/v1beta1”,
“/apis/scheduling.k8s.io”,
“/apis/scheduling.k8s.io/v1”,
“/apis/scheduling.k8s.io/v1beta1”,
“/apis/storage.k8s.io”,
“/apis/storage.k8s.io/v1”,
“/apis/storage.k8s.io/v1beta1”,
“/healthz”,
“/healthz/autoregister-completion”,
“/healthz/etcd”,
“/healthz/log”,
“/healthz/ping”,
“/healthz/poststarthook/apiservice-openapi-controller”,
“/healthz/poststarthook/apiservice-registration-controller”,
“/healthz/poststarthook/apiservice-status-available-controller”,
“/healthz/poststarthook/bootstrap-controller”,
“/healthz/poststarthook/ca-registration”,
“/healthz/poststarthook/crd-informer-synced”,
“/healthz/poststarthook/generic-apiserver-start-informers”,
“/healthz/poststarthook/kube-apiserver-autoregistration”,
“/healthz/poststarthook/scheduling/bootstrap-system-priority-classes”,
“/healthz/poststarthook/start-apiextensions-controllers”,
“/healthz/poststarthook/start-apiextensions-informers”,
“/healthz/poststarthook/start-kube-aggregator-informers”,
“/healthz/poststarthook/start-kube-apiserver-admission-initializer”,
“/logs”,
“/metrics”,
“/openapi/v2”,
“/version”
]
}

Straight out of the kubernetes-core readme

juju scp kubernetes-master/0:config ~/.kube/config

kubectl proxy 

http://localhost:8001/api/v1/namespaces/kube-system/services/https:kubernetes-dashboard:/proxy/

in this way?:

Ubuntu 18.04 Maas Server Edition
$ mkdir -p ~/.kube
$: juju scp kubernetes-master/0:config ~/.kube/config
$: sudo snap install kubectl --classic

Ubuntu 18.04 Maas Server Edition
$:kubectl cluster-info
Kubernetes master is running at https://10.20.81.223:6443
Heapster is running at https://10.20.81.223:6443/api/v1/namespaces/kube-system/services/heapster/proxy
CoreDNS is running at https://10.20.81.223:6443/api/v1/namespaces/kube-system/services/kube-dns:dns/proxy
Metrics-server is running at https://10.20.81.223:6443/api/v1/namespaces/kube-system/services/https:metrics-server:/proxy
Grafana is running at https://10.20.81.223:6443/api/v1/namespaces/kube-system/services/monitoring-grafana/proxy
InfluxDB is running at https://10.20.81.223:6443/api/v1/namespaces/kube-system/services/monitoring-influxdb:http/proxy

then

Ubuntu 18.04 Maas Server Edition
$:kubectl proxy 
Starting to serve on 127.0.0.1:8001

^C

using http://localhost:8001/api/v1/namespaces/kube-system/services/https:kubernetes-dashboard:/proxy

the page is white, while with https://10.20.81.223:6443/ as above!!! :frowning: