
Generally we can think of a spark deploy as something more than just a single node. The following bundle will help get you started in the right direction toward a very usable standalone spark cluster.
Spark Standalone Bundle Core Components
The spark standalone bundle deploy consists of a few different components.
The core components:
| Component | Github | Charmstore |
|---|---|---|
| spark | layer-spark | cs:~omnivector/spark |
| layer-spark-base | ||
| layer-hadoop-base | ||
| conda | layer-conda | cs:~omnivector/conda |
| layer-conda-api | ||
| jupyter-notebook | layer-jupyter-notebook | cs:~omnivector/jupyter-notebook |
The peripheral/monitoring components:
| Component | Charmstore |
|---|---|
| telegraf | cs:~telegraf |
| grafana | cs:~grafana |
| prometheus2 | cs:~prometheus2 |
Deploy the Bundle
To deploy this bundle put the following yaml into a file and deploy it with juju deploy bundle.yaml.
bundle.yaml
series: bionic
applications:
  grafana:
    charm: cs:grafana-23
    num_units: 1
    expose: true
    constraints: root-disk=20480 instance-type=t3.large
  jupyter-notebook:
    charm: cs:~omnivector/jupyter-notebook
    num_units: 1
    expose: true
    constraints: root-disk=51200 instance-type=t3.xlarge
  prometheus2:
    charm: cs:prometheus2
    num_units: 1
    constraints: root-disk=51200 instance-type=t3.large
  pyspark:
    charm: cs:~omnivector/conda
    num_units: 0
    options:
      conda-extra-packages: pyspark=2.4.0 numpy ipykernel pandas pip
  spark:
    charm: cs:~omnivector/spark
    num_units: 10
    expose: true
    constraints: root-disk=51200 instance-type=t3.2xlarge
    storage:
      spark-work: ebs-ssd,100G
      spark-local: ebs-ssd,100G
  telegraf:
    charm: cs:telegraf-27
    num_units: 0
relations:
- - pyspark:juju-info
  - spark:juju-info
- - pyspark:juju-info
  - jupyter-notebook:juju-info
- - telegraf:juju-info
  - spark:juju-info
- - grafana:grafana-source
  - prometheus2:grafana-source
- - telegraf:prometheus-client
  - prometheus2:target
- - telegraf:juju-info
  - jupyter-notebook:juju-info
Result
Model       Controller  Cloud/Region   Version  SLA          Timestamp
spark-0000  pdl-aws     aws/us-west-2  2.5.4    unsupported  00:43:35Z

App               Version  Status  Scale  Charm             Store       Rev  OS      Notes
grafana                    active      1  grafana           jujucharms   23  ubuntu  exposed
jupyter-notebook           active      1  jupyter-notebook  jujucharms   32  ubuntu  exposed
prometheus2                active      1  prometheus2       jujucharms    8  ubuntu
pyspark                    active     11  conda             jujucharms   20  ubuntu
spark             2.4.1    active     10  spark             jujucharms   35  ubuntu  exposed
telegraf                   active     11  telegraf          jujucharms   27  ubuntu

Unit                 Workload  Agent  Machine  Public address  Ports                                          Message
grafana/0*           active    idle   28       172.31.104.241  3000/tcp                                       Started grafana-server
jupyter-notebook/0*  active    idle   26       172.31.104.248  8888/tcp                                       http://172.31.104.248:8888
  pyspark/20         active    idle            172.31.104.248                                                 Conda Env Installed: pyspark
  telegraf/20        active    idle            172.31.104.248  9103/tcp                                       Monitoring jupyter-notebook/0
prometheus2/0*       active    idle   27       172.31.104.230  9090/tcp,12321/tcp                             Ready
spark/1*             active    idle   1        172.31.102.231  7077/tcp,7078/tcp,8080/tcp,8081/tcp,18080/tcp  Running: master,worker,history
  pyspark/0*         active    idle            172.31.102.231                                                 Conda Env Installed: pyspark
  telegraf/13        active    idle            172.31.102.231  9103/tcp                                       Monitoring spark/1
spark/13             active    idle   13       172.31.104.237  7078/tcp,8081/tcp                              Services: worker
  pyspark/9          active    idle            172.31.104.237                                                 Conda Env Installed: pyspark
  telegraf/10        active    idle            172.31.104.237  9103/tcp                                       Monitoring spark/13
spark/15             active    idle   15       172.31.103.234  7078/tcp,8081/tcp                              Services: worker
  pyspark/16         active    idle            172.31.103.234                                                 Conda Env Installed: pyspark
  telegraf/9         active    idle            172.31.103.234  9103/tcp                                       Monitoring spark/15
spark/16             active    idle   16       172.31.103.114  7078/tcp,8081/tcp                              Services: worker
  pyspark/19         active    idle            172.31.103.114                                                 Conda Env Installed: pyspark
  telegraf/12        active    idle            172.31.103.114  9103/tcp                                       Monitoring spark/16
spark/17             active    idle   17       172.31.102.13   7078/tcp,8081/tcp                              Services: worker
  pyspark/11         active    idle            172.31.102.13                                                  Conda Env Installed: pyspark
  telegraf/0*        active    idle            172.31.102.13   9103/tcp                                       Monitoring spark/17
spark/18             active    idle   18       172.31.102.155  7078/tcp,8081/tcp                              Services: worker
  pyspark/15         active    idle            172.31.102.155                                                 Conda Env Installed: pyspark
  telegraf/5         active    idle            172.31.102.155  9103/tcp                                       Monitoring spark/18
spark/20             active    idle   20       172.31.102.204  7078/tcp,8081/tcp                              Services: worker
  pyspark/12         active    idle            172.31.102.204                                                 Conda Env Installed: pyspark
  telegraf/11        active    idle            172.31.102.204  9103/tcp                                       Monitoring spark/20
spark/21             active    idle   21       172.31.104.85   7078/tcp,8081/tcp                              Services: worker
  pyspark/14         active    idle            172.31.104.85                                                  Conda Env Installed: pyspark
  telegraf/15        active    idle            172.31.104.85   9103/tcp                                       Monitoring spark/21
spark/24             active    idle   24       172.31.102.238  7078/tcp,8081/tcp                              Services: worker
  pyspark/18         active    idle            172.31.102.238                                                 Conda Env Installed: pyspark
  telegraf/6         active    idle            172.31.102.238  9103/tcp                                       Monitoring spark/24

Machine  State    DNS             Inst id              Series  AZ          Message
1        started  172.31.102.231  i-0e76f0515db3ef90e  bionic  us-west-2a  running
13       started  172.31.104.237  i-0831223f2314c426c  bionic  us-west-2c  running
15       started  172.31.103.234  i-0f17d1e2c9cee938b  bionic  us-west-2b  running
16       started  172.31.103.114  i-0bb906ad5ab4cc227  bionic  us-west-2b  running
17       started  172.31.102.13   i-0e2c2cd380e2b61da  bionic  us-west-2a  running
18       started  172.31.102.155  i-008d16354d8c3e7eb  bionic  us-west-2a  running
20       started  172.31.102.204  i-0abe5d7237ef8d70a  bionic  us-west-2a  running
21       started  172.31.104.85   i-08eaefd1632223fb0  bionic  us-west-2c  running
24       started  172.31.102.238  i-0b56741810fc00e32  bionic  us-west-2a  running
26       started  172.31.104.248  i-0fb7da77bfaf82c5e  bionic  us-west-2c  running
27       started  172.31.104.230  i-0e77e7c0eb2dd5d14  bionic  us-west-2c  running
28       started  172.31.104.241  i-0ffbbc8e3d741bb0c  bionic  us-west-2c  running
Usage
Login to the jupyter notebook at the ip address and port shown in the juju status. Using the example above, the jupyter-notebook can be accessed at http://172.31.104.248:8888.
Once you are logged into the jupyter-notebook ui, go ahead and fire up a new notebook in the environment created by the conda charm.
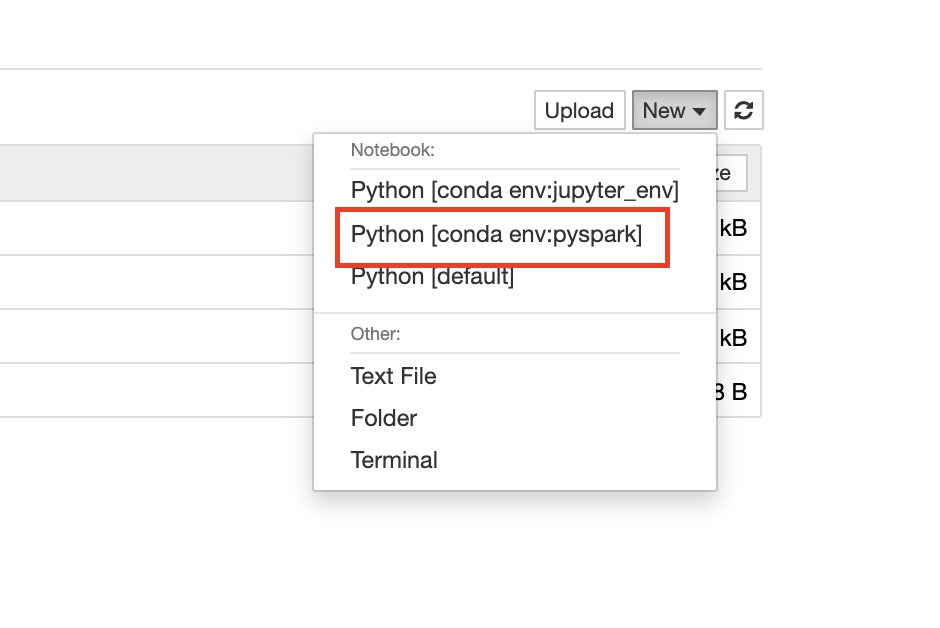
As you can see, the conda environment will have the same name as the deployed conda charm.
In this case our conda charm application name is ‘pyspark’ and as such we should find a conda environment created with the name ‘pyspark’.
Inform the notebook environment where PYSPARK_PYTHON is by assigning it the value that is the location of the conda environment python. In this example we would use:
os.environ['PYSPARK_PYTHON'] = '/opt/conda/envs/pyspark/bin/python'
Verification
A simple example to verify everything is working (substitute in your own spark-master ip):
import os
os.environ['PYSPARK_PYTHON'] = '/opt/conda/envs/pyspark/bin/python'

from pyspark.sql import SparkSession
from pyspark import SparkConf

import random


conf = SparkConf()\
    .setAppName('JUJU_PI_TEST')\
    .setMaster('spark://<spark-master-ip>:7077')

spark = SparkSession.builder.config(conf=conf).getOrCreate()

sc = spark.sparkContext

num_samples = 100000000

def inside(p):
  x, y = random.random(), random.random()
  return x*x + y*y < 1

count = sc.parallelize(range(0, num_samples)).filter(inside).count()
pi = 4 * count / num_samples

print(pi)
sc.stop()
Test S3A Works
A simple cell to verify S3A is working correctly across the c;luster. Once deployed, run the following cell in your notebook substituting in your own aws credentials + s3 endpoint, spark master ip, and s3 file location.
import os
os.environ['PYSPARK_PYTHON'] = '/opt/conda/envs/pyspark/bin/python'

from pyspark.sql import SparkSession
from pyspark import SparkConf


conf = SparkConf()\
    .setAppName('JUJU_S3A_TEST')\
    .setMaster('spark://<spark-master-ip>:7077')\
    .set('spark.jars.packages', 'org.apache.hadoop:hadoop-aws:3.1.2')

spark = SparkSession.builder.config(conf=conf).getOrCreate()

sc = spark.sparkContext
sc._jsc.hadoopConfiguration().set("fs.s3a.connection.ssl.enabled", "true")
sc._jsc.hadoopConfiguration().set("fs.s3a.endpoint", "<aws-s3-endpoint>")
sc._jsc.hadoopConfiguration().set("fs.s3a.access.key", "<aws-access-key>")
sc._jsc.hadoopConfiguration().set("fs.s3a.secret.key", "<aws-access-key-id>")

sc.textFile("s3a://a/file/in/my/s3bucket.json").take(1)
Monitoring
Login to the grafana monitoring dashboard by retrieving the ip address from the grafana charm and accessing the grafana web ui.
Access the grafana web ui at: http://172.31.104.241:3000
user: admin
password: juju run-action grafana/0 get-admin-password --wait --format json | jq -r '.[]["results"]["password"]'