
Tutorial: Getting started with ELK
Difficulty: Intermediate
Author: Erik Lönroth and @xinyuem
What you will learn
- How to deploy the ELK stack.
- How to send logs through a custom pyhton application.
- Use a juju action to perform workload in a charm.
- How to add the filebeat charm to track logs in a custom logfile.
Preparations
- You should have a working juju client setup. (Like in this example: Installing juju)
- You should be fairly confident deploying charms with juju.
- Basic understanding of Python is good.
The ELK stack
The ELK Stack comprises three components: Elastic Search, Logstash & Kibana, allowing for search, analytics and visualization of logging data. There are other similar stacks, but this is a common one.
Here is a picture of the ELK architecture.
Deploy it from charm store
juju deploy cs:~omnivector/bundle/elk
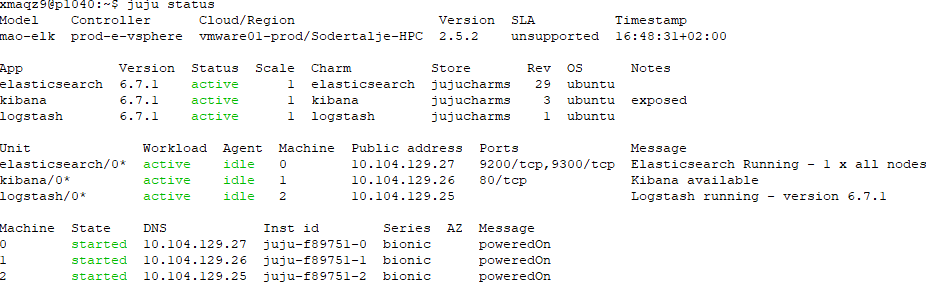
The status shows when its ready:
We can now test if the ELK Stack components works as expected. We do this by generating some “random noise” that we can see in the web interface Kibana.
-
Generate some noise:
generate-noiseis a logstash juju action, that generates logs for temporary use.When the deploy is ready, lets use the
generate-noisejuju action:juju run-action logstash/0 generate-noiseRetrieve the results from the action by:
watch juju show-action-statuscopy action id and do this:
juju show-action-output <action-id> -
Login kibana, setup first index
We check juju structure status by using this command again:
juju statusFind unit Kibana and copy corresponding IP address, then paste into any browser.
Check kibana document to get the login information, then hit Enter!
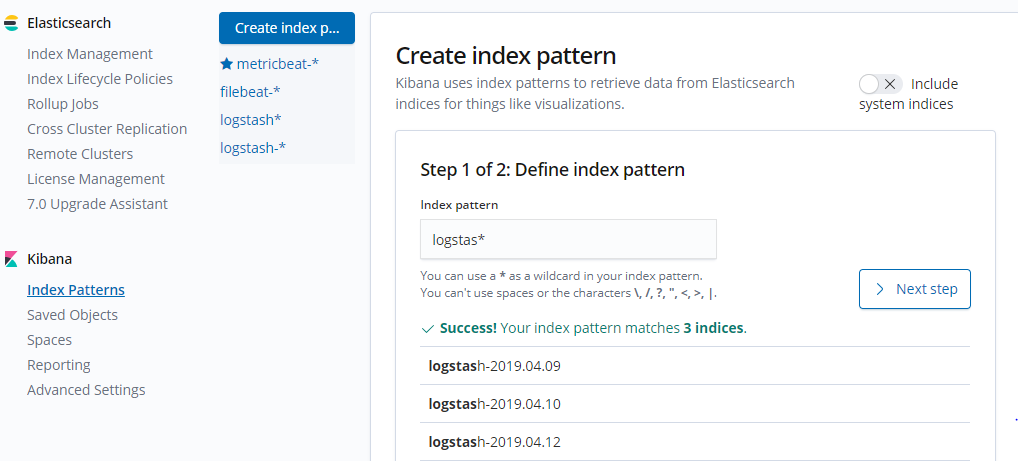
Now we login to Kibana!Choose Management -> Index Patterns -> Create Index Pattern
In search box, if we inputlogstash*, then the noise generated will appear underneath. Then Next Step.
We could choose filter index by @timestamp, and Create Index Pattern.
-
Look at the noise in the web
We go back to see the left bar, choose Discover on the top. Then click the name we created for index pattern several steps ago. In this case, the option should be
logstash*.
Adjust the filter parameters according to your requirement, then you would see the visualized log (noise) data come out!Yay~~ You are awesome!
Send logs with python-logstash
Its now possible to send logs to logstash with you applications. To demo this, we will deploy a charm called tiny-python. From that tiny-python unit, we will send some logs to the ELK stack.
Start by deploying tiny-python.
juju deploy cs:~erik-lonroth/tiny-python
Now, login to the tiny-python unit which will be used to send logs from.
juju ssh tiny-python/0
Once logged in, install python-logstash with pip:
sudo pip3 install python-logstash
Now, create a python script: my-logstash-script.py
For success, you need to figure out the IP address of the logstash unit. We leave that up to you to figure out before we move on.
The script should look like this:
import logging
import logstash
import sys

# IP address of the logstash unit need to go here.
host = '<ip-of-the-logstash-unit>'

test_logger = logging.getLogger('python-logstash-logger')
test_logger.setLevel(logging.INFO)

# Port for UDP is: 5000, TCP: 6000
test_logger.addHandler(logstash.LogstashHandler(host, 5000, version=1))
# test_logger.addHandler(logstash.TCPLogstashHandler(host, 6000, version=1))

test_logger.error('python-logstash: test logstash error message.')
test_logger.info('python-logstash: test logstash info message.')
test_logger.warning('python-logstash: test logstash warning message.')

# add extra field to logstash message
extra = {
    'test_string': 'python version: ' + repr(sys.version_info),
    'test_boolean': True,
    'test_dict': {'a': 1, 'b': 'c'},
    'test_float': 1.23,
    'test_integer': 123,
    'test_list': [1, 2, '3'],
}

test_logger.info("python-logstash: test extra fields", extra=extra)
Good work! You are now ready to send logs to logstash!
Execute the test
Go ahead and run the script that will send some logs over UDP to logstash.
python3 my-logstash-script.py
You should now be able go back to Kibana and add another index and see your logs coming in.
Here is an example of visualized log data in Kibana with index “logstash-”:
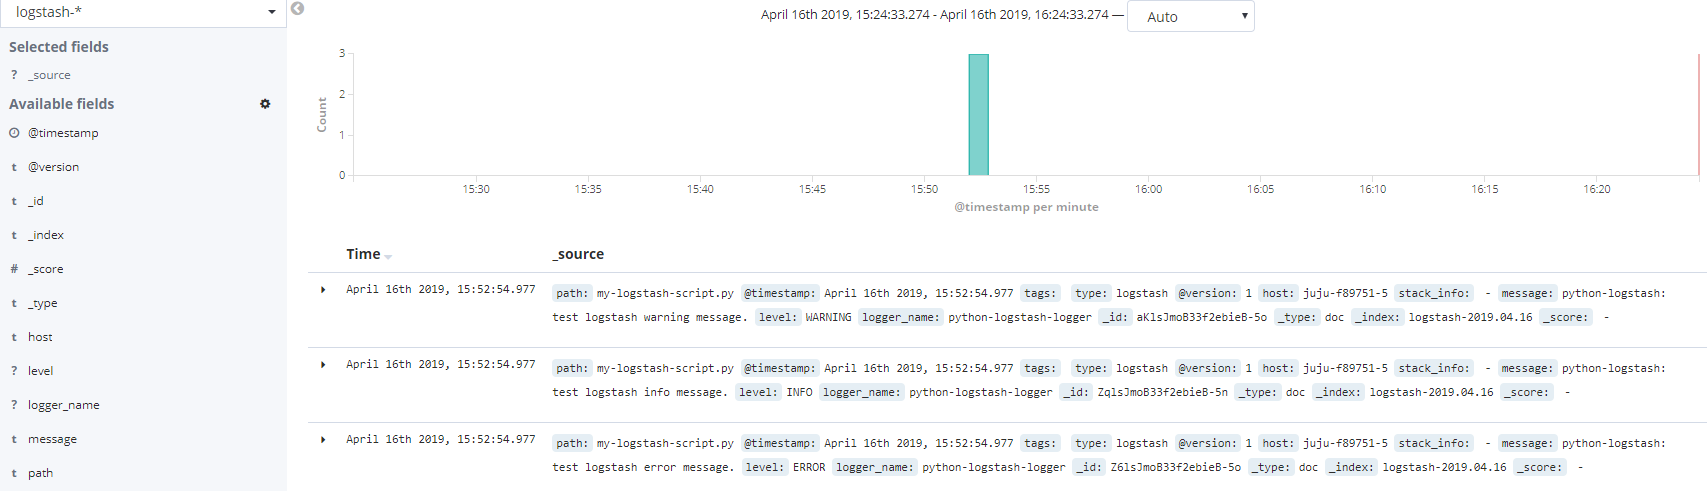
Great work, you should now have the basics for sending logs to logstash.
Before you move on, why dont you modify the script to use TCP as the carrier protocol?
Next step: logging to files
What if you have a file with logs and want to monitor that for log entries? After all, this is very common.
We can use juju again to add in filebeat to the equation. Filebeat is made to monitor files.
Making use of filebeat is easy with juju.
Add filebeat
Deploy filebeat and relate it to the exising tiny-python charm, then filebeat charm is related to logstash. Like this:
juju deploy filebeat
juju relate filebeat tiny-python
juju relate filebeat logstash
Decide on files to monitor
The filebeat charm can be configured to monitor any file. Lets change the default config and monitor the file: ‘/home/ubuntu/mylogfile.log’
juju config filebeat logpath="/home/ubuntu/mylogfile.log"
Now, lets write some log messages to the file:
echo "HELLO WORLD OF LOGS" >> /home/ubuntu/mylogfile.log
Add the new index to kibana
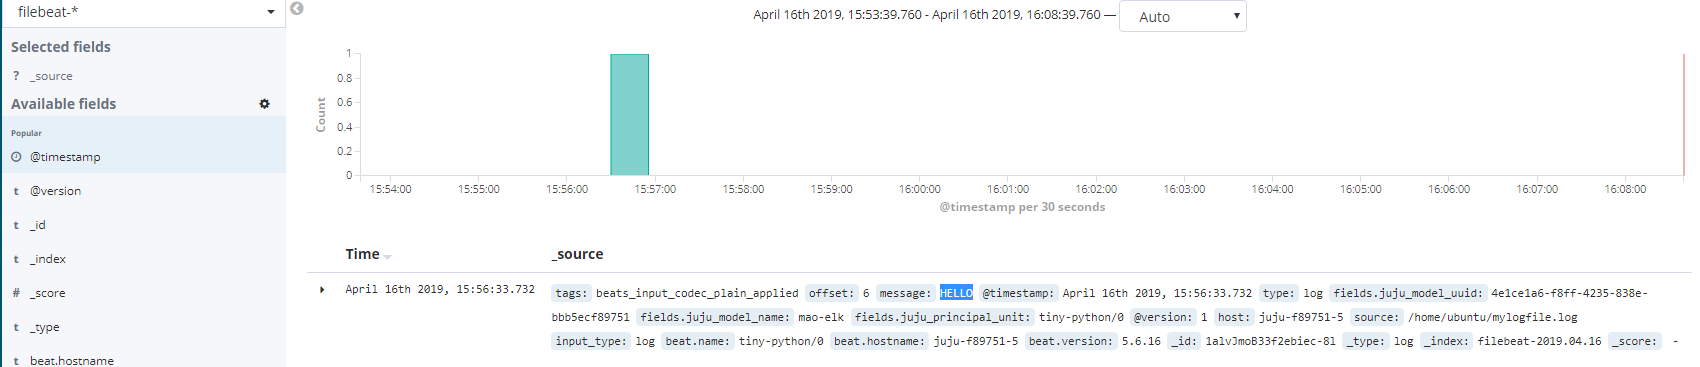
To see the logs coming in from filebeat (your logfile), add another index (filebeat-) in kibana and you are all set.
Here is an example demonstrating “HELLO” in log file which filebeat monitered.
Amazing job! You are now an ELK wizard.
Contributors
@jamesbeedy - for peer reviewing and maintaining the charms for ELK!
Erik Peterson at Scania for peer reviewing.
Andrew Smith at Scania for language and peer-reviewing.